|
|

|
|
|
«
Previous Thread
|
Next Thread
»
|


|
| About Us | |
| We are a community-driven platform of critical code experts and researchers working on the Middle East. The goal is to promote procedural and digital literacy by providing a research & development platform for innovative knowledge production on the Middle East. We believe that procedural literacy provides a key to 21st century democratic practices. | |
|
| ARCHIVE |
|
|
| R-Shief Blog |
| R-Shief’s new blog on various issues concerning transnational Arab culture, media, technology, critical code, or other interdisciplinary research questions. |
| Navigation: |
| #1 | |
|
Administrator
11-12-11  |
An Unprecedented Event: #OccupyData Global Hackathon Days 1 & 2
Occupydata, an event hosted by R-Shief.org with several co-sponsors and steering committee, created a quiet buzz within the social network and media world when R-Shief announced the opening of its #occupy tags and analytics for a 3-day hackathon. On Twitter, the number of posts that included #OccupyData rose as soon as the announcement was released on Wednesday, December 7. Out of Stanford University, @Liberationtech tweeted, "Extraordinary & Unprecedented: #OccupyData Hackathon to Bring Together Academics & Activists." Another influential tweet by Ethan Zuckerman was retweeted 44 times on December 7: "You're invited to the #OccupyData hackathon, analyzing #OWS data at @civicMIT." While the outcomes from this experimental event are proving to be more than a series of smart, useful, and beautiful data visualizations created in 48 hours, perhaps more importantly, what has emerged is systematic documentation of our process (by way of videos, notepads shared online, recorded conversations, and many backchannels). Our process also included synchronizing among four venues -- Utrecht in the Netherlands to Zaragoza, Spain to Cambridge and Los Angeles in the US. We hope the trails we leave behind will serve future research and development in the area of social networks, resistance, data visualization, social media analytics, and the occupy movement.
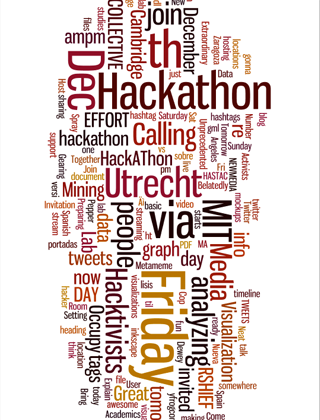
 Fig. 1. Live graph of analytics on #OccupyData Twitter feed as we authored it. Total of 643 tweets over 14 days from November 28 – December 11, 2011. We organized this event seeking how we might apply the mechanics of the occupy movement to the data of Twitter itself? #OccupyData is meant to serve as an intervention by offering experts and activists means to work together and think critically about the movement -- how its messages, goals, the role new media, and specifically, Twitter might play in this system. Officially, 39 people registered for the event internationally to receive open access to R-Shief's collection and swarm computing analytics. Joining us on backchannels like Ustream and IRC channel were experts such as Gilad Lotan from Social Flow who, along with others, gave online advice and lectures. The pedagogical implications of this experiment are many -- bringing activists, whose learning is self-directed and modus operandi is often speed over rigor, with academics, whose reflexive methods often require time and are embedded in privileged, hierarchical systems of learning, is ambitious to say the least. In trying to tailor this event for both activist and academic audiences, some design processes failed to work cohesively. For example, the request for academic participants to “register” is both understood and gives credibility to the event within that community. However, asking hackers and activists to register intrudes into the veil of anonymity many Western activists create (i.e. Bansky and Anonymous). Within a few hours of day one of the hackathon, someone created a bit-torrent of the data that enabled users to bypass the registration process. It is made available on the Google public document that has become the centralized repository about the hackathon, being co-edited by over 25 users at once. 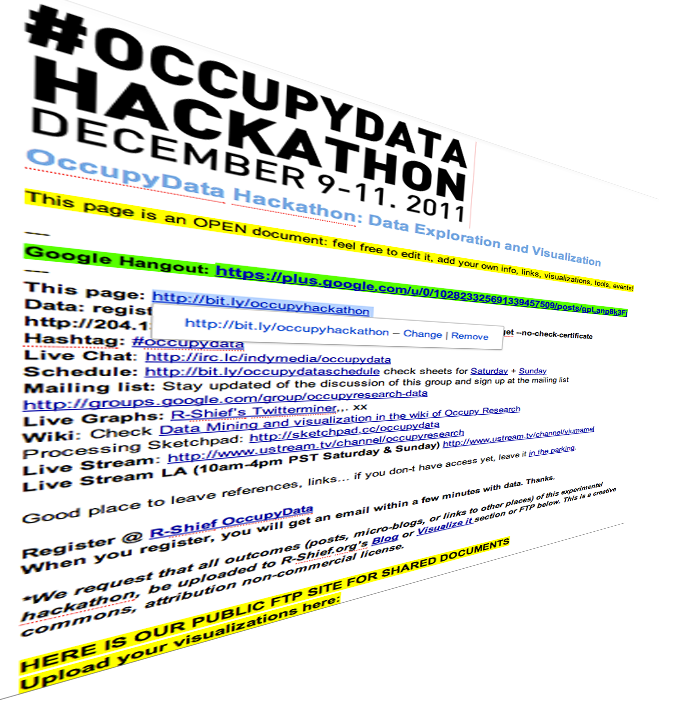 Fig. 2. Google document that was universally shared and often had 25 people logged into it at once. Contains rich list of resources for hackathon. We knew that eventually it would happen, but still wanted to see how the hacking of the registration system would unfold. The conversation about how accessible we made the database was discussed among the steering committee with rigor months before as we planned the event. Requesting each person to register in order to use the data served two purposes. One, we asked users to agree to an attribution, non-commercial licensing on the registration form. And, two, we wanted to know what would happen with the data and have a centralized location to showcase the outcomes of the event. There was another reason why we had asked people to register – and that is we are in pursuit of workable models for organizing ourselves in a post-Arab Revolution, post-OccupyWallStreet, post-Twitter world. On some levels, the information age is one of hyper-transparency, and inevitable surveillance. One tactic that we were trying to employ is a process of sousveillance – a type of inverse surveillance or "watchful vigilance from underneath.” Here is a 2 minute video I had done on the theme back in 2008: Sousveillance seems to be working in the Middle East where activists and bloggers are known not only by name, but also by face, a face that sometimes carries symbolic meaning. One of the sparks of the Egyptian revolutions was the spreading of the face of the Alexandrian who was brutally killed in 2010, Khaled Said. And, more recently, the names and faces of Egyptian activist Alaa Abd El-Fattah jailed under false charges, and Palestinian protester, Mustafa Tamimi who was killed just two days ago, are common. Not to make it sound too simplistic, but I wonder what are the cultural differences that might foster this Western anonymity and Middle Eastern hyper-transparency? Or is it visibility? Is there a difference? What is at stake for these divergent tactical methods? #OCCUPYDATA HACKATHON DAY 1 For me in Los Angeles (see #OccupyData schedule), Friday morning began very early (9 hours behind UTC in West Europe) to synchronize with fellow hackers in the Netherlands who had organized a team of students and faculty from Utrecht University’s New Media Master’s program. In a blog post about the event, Assistant Professor Mirko Schaefer wrote, “NMDC students are interested in data analysis and visualization. Popular platforms such as Twitter generate large amounts of data that can be scraped from the Internet.” Indeed, these guys (Ryanne Turenhout, Thomas Boeschoten and Ruben Hazelaar from UU) were motivated and had blown through the dataset before I actually woke up. See article. Meanwhile, the guys in Boston were arriving to the MIT Media Lab after a night when the #OccupyBoston protestors were evicted by authorities. The fast-paced “Twitter energy" was palpable as hackers tweeted each other in efforts to synchronize. By the time we started the hackathon in Los Angeles, the group in Zaragoza, Spain was giving a brilliant lecture on UStream on “Complex Systems and Networks Group of the Institute for Biocomputation and Physics of Complex Systems." Twitter research #spanishrevolution 15m 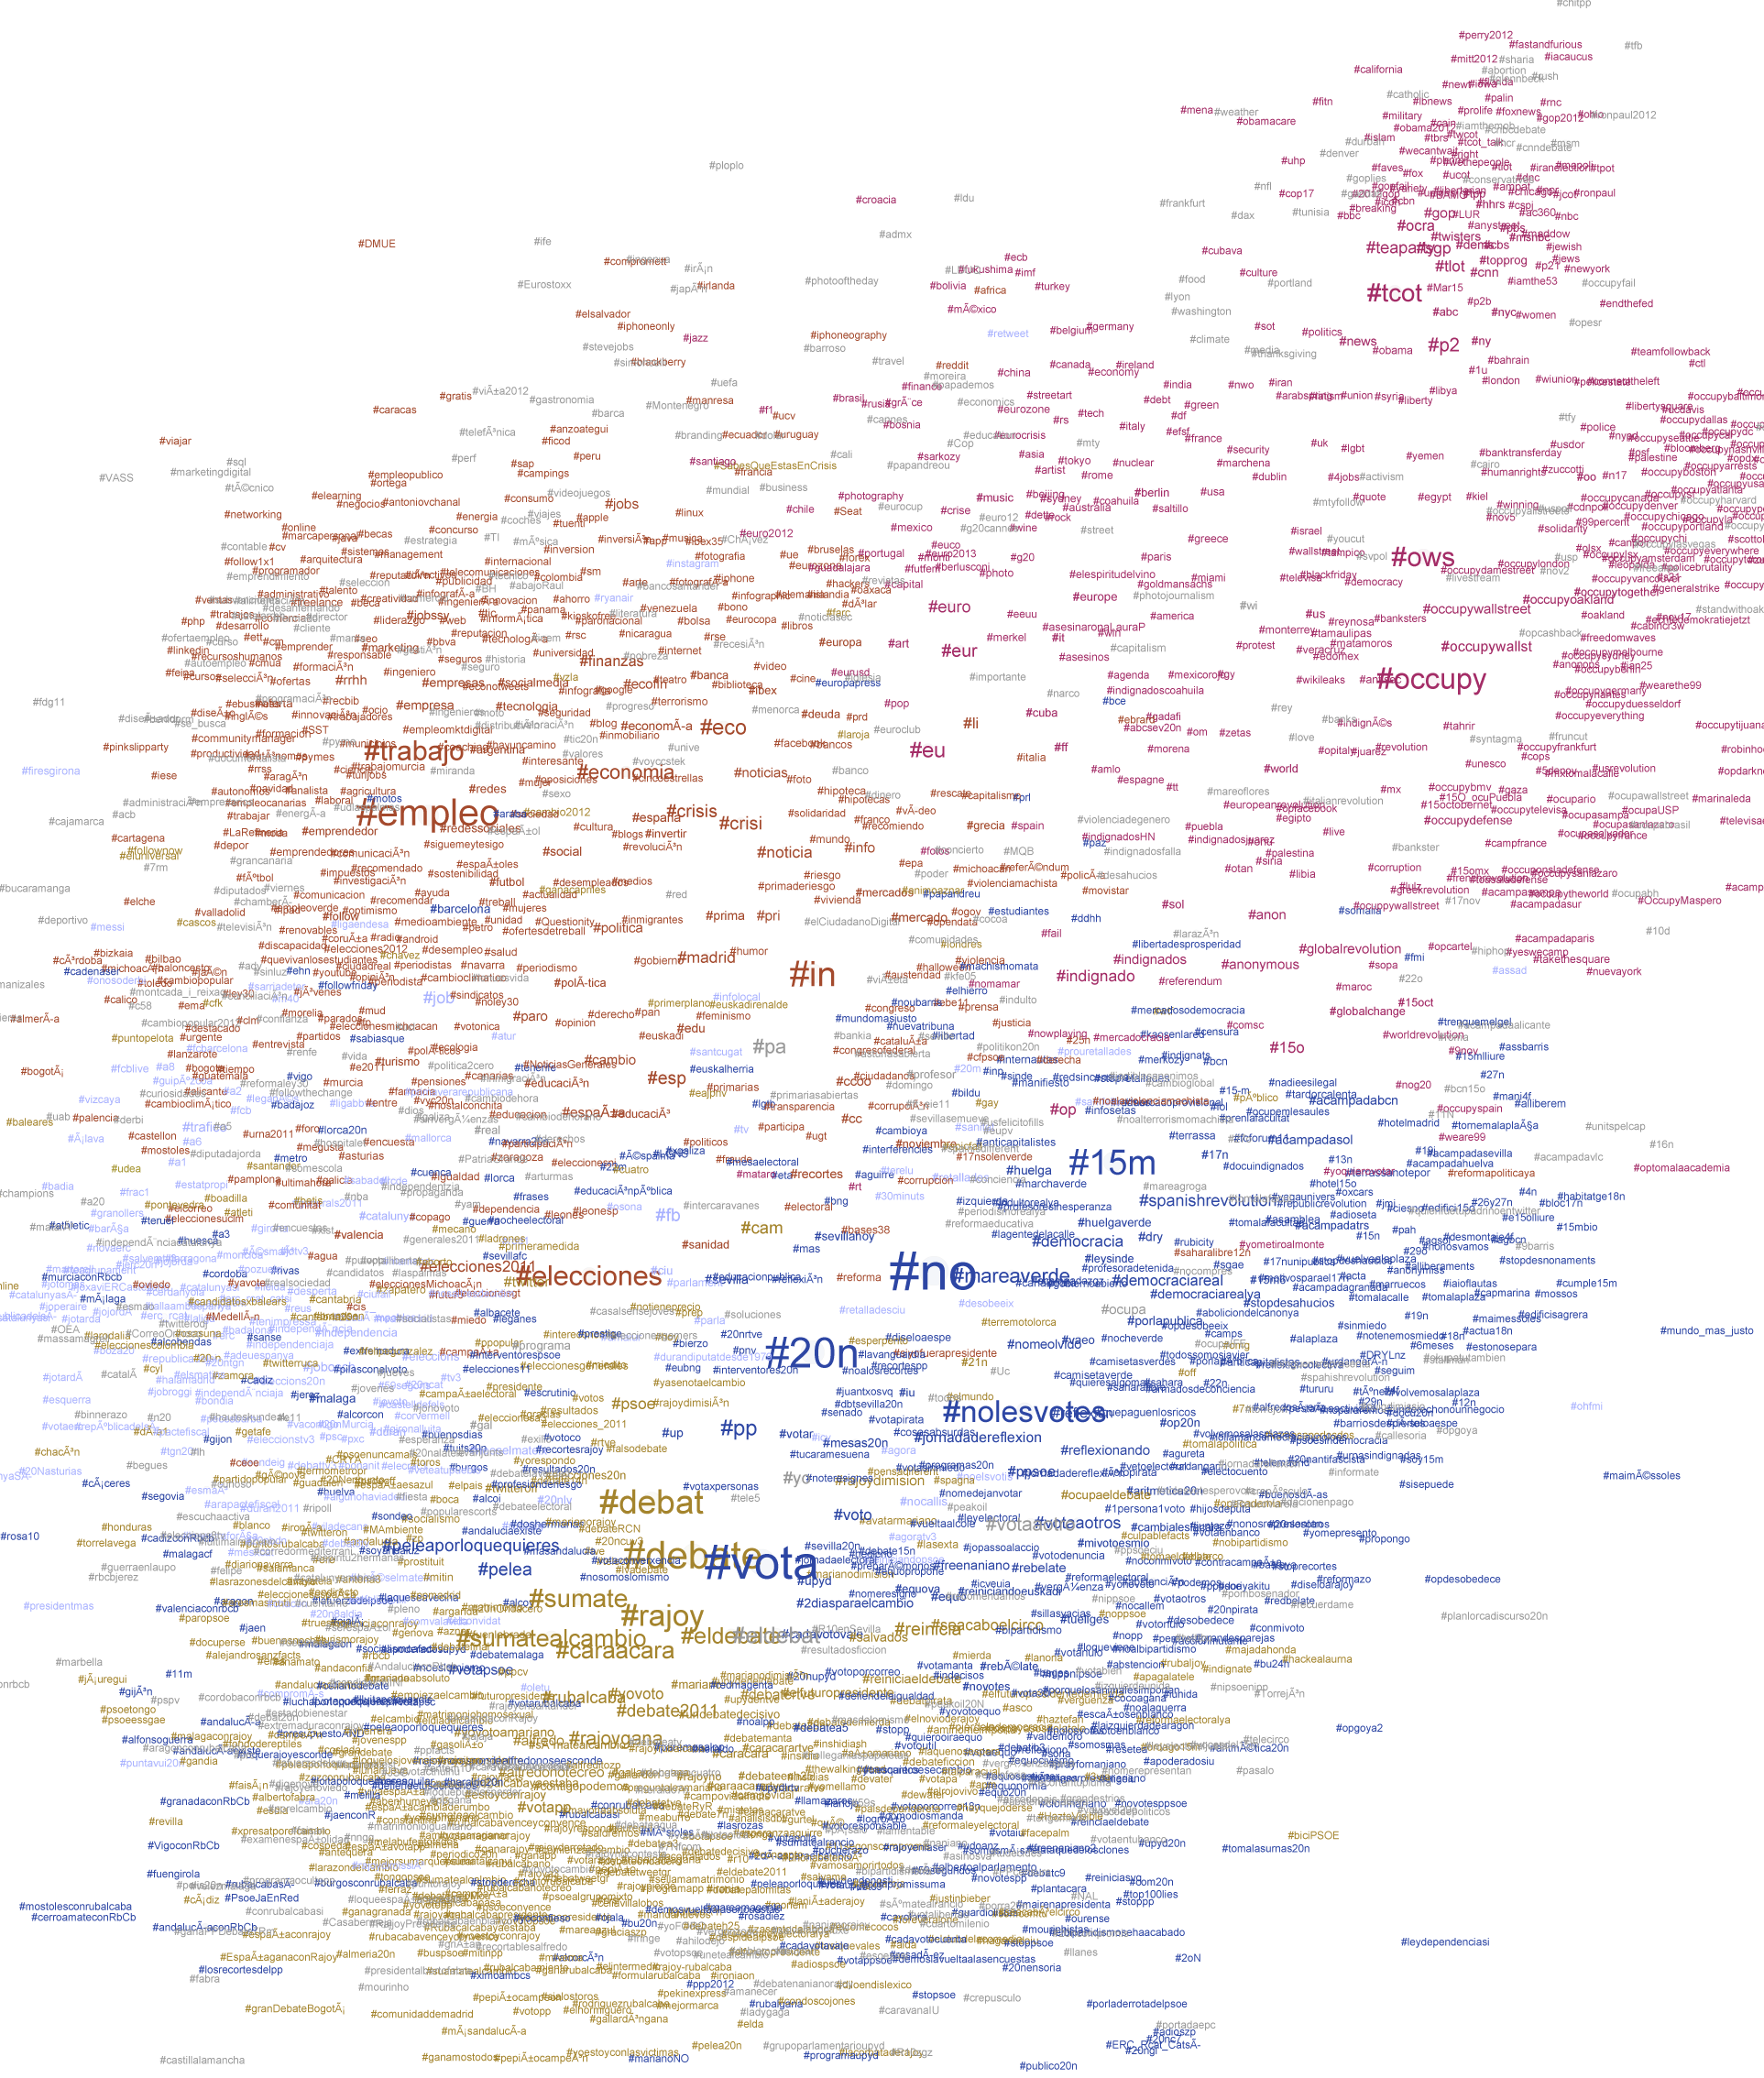 Fig. 3. This is a typical co-occurrence map of hashtags (Spanish #elections in November 2011) Meanwhile, the team in Utrecht had sent me a dropbox link to a bunch of files they had processed for network analysis using Gephi. But after doing so, they realized they had much more than they could analyze and wanted to share the files with others in the hackathon. And at the MIT Media Lab in Cambridge, Sasha Costanza-Chock, Pablo Rey, and Kawandeep had uploaded a series of images reflecting the results of their whiteboard brainstorming session. 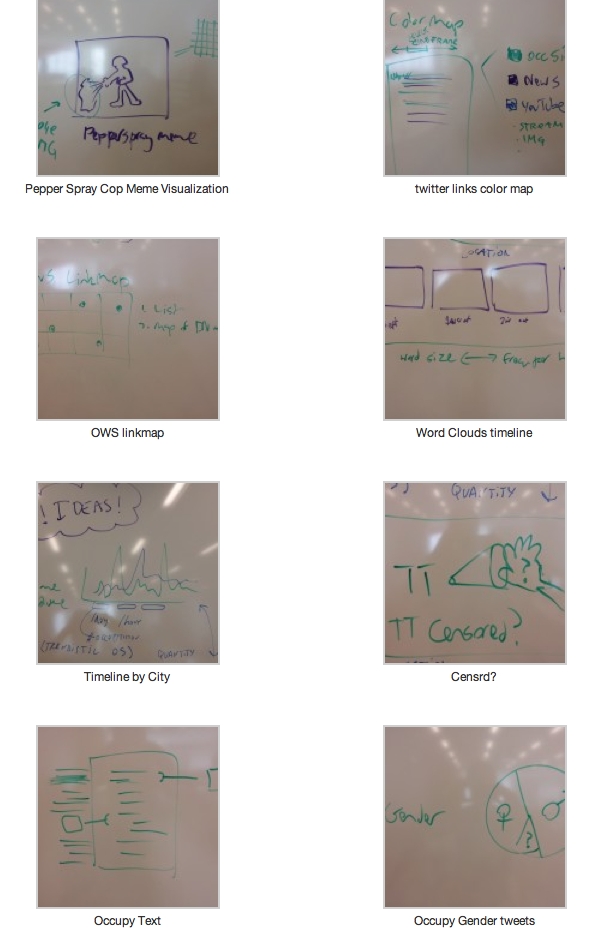 Fig.4. The systematic documentation conducted on the Occupy Research website for the hackthon is a rich contribution. To view each image, see blog post about this Brainstorming Session. At this point, both groups had realized the broad scope of the project and decided to focus on one corpus of data. The Utrecht team focused their work on the OccupyAmsterdam tags, while the MIT team focused on the OccupyBoston tags – each making use of their local experience and knowledge. After watching the truly inspiring work presented in Spain via UStream, Alex Leavitt and myself, located in the Blue Lab of USC’s Institute for Multimedia Literacy in Los Angeles, joined the couple of participants in Cambridge and Utrecht in Google Hangout. We live streamed the conversation for other’s to watch and join in.  Fig. 5. Google Hangout where Sasha, Pablo, and Kawandeep were presenting their white boards. While the other teams were thinking through the various available datasets, in Los Angeles, fellow USC PhD students Alex Leavitt, Micha Cárdenas, and I engaged in long conversations around the design process of analysis – the value of qualitative versus quantitative study. We discussed the role of ethics in new models of communication and social interactions. In a post-DIY world, where are our value economies? We also spent time engaging the questions Micha posted on Twitter the night before. She asked, “#OccupyData: can we use the data to visualize the scope of violence? global num of arrests? of police? of types of arrests?” And, “can we dynamically shift qualities like size, attitude towards police, economic status 2 various qualities like color & shape?” Ultimately, “how can you visualize a mass movement of locally autonomous collectivities? Or even a single occupation?” #OCCUPYDATA HACKATHON DAY 2 On day two, we started seeing visuals and more documentation emerge. The morning began with several people using pad.riseup to make choices about what scripts, and software to use in various visualizations. We were able to both collaborate on decisions as well have preserved documentation of that process. See Occupy LinkViz first steps |Occupy Research. 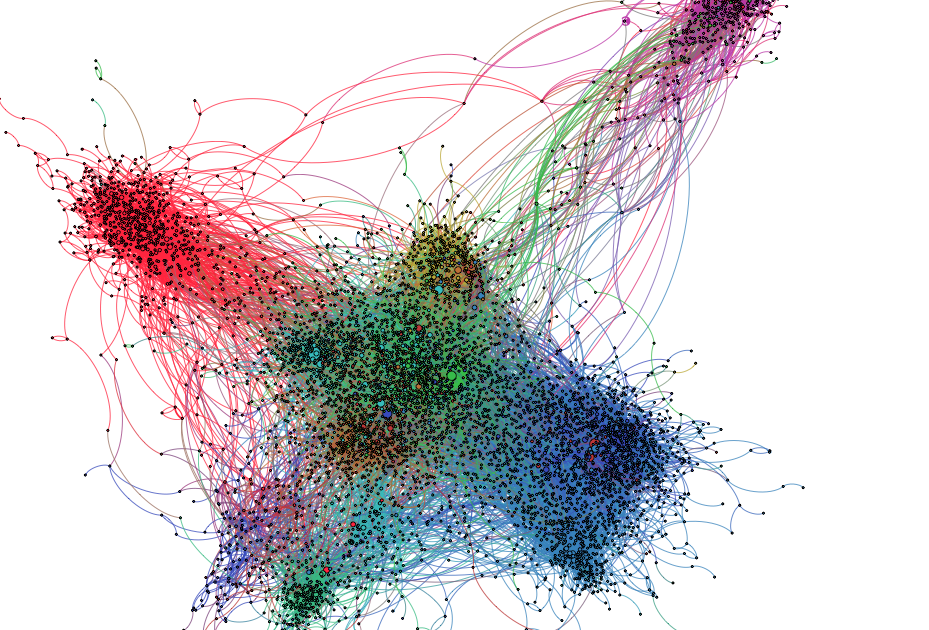 Fig. 6. For explanation of iterations and for documentation, see Ryanne Turenhout's post on Visualizing 14 @reply hashtag networks visualised in Gephi]Visualising 14 hashtag networks #OccupyData | rlturenhout Also, here is a follow-up article the Utrecht team co-authored on Day 3, #OccupyData Hackathon. Analysing millions of tweets. 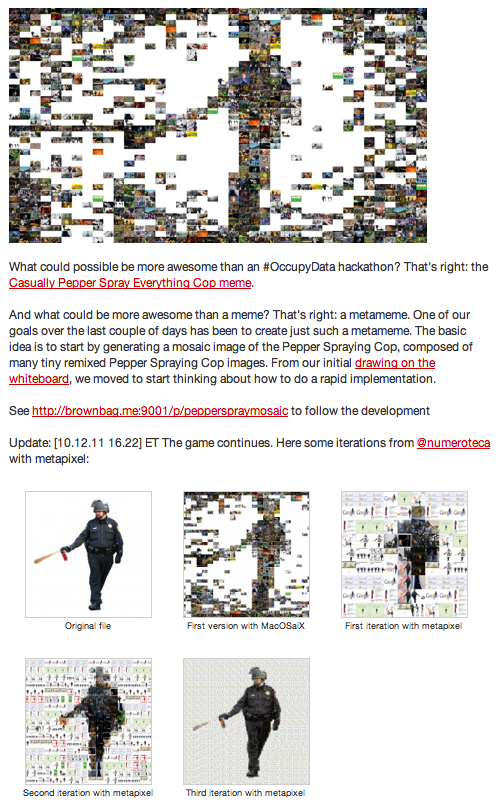 Fig. 7. For explanation of iterations and for documentation, see Pablo Rey's post on Metameme: Pepper Spray Cop Mosaic | Occupy Research Fig. 8. This graph indicates the total number of participants an number of tweets used in this #OccupyData hackathon. For documentation, see number of #OWS Participants in Twitter |Occupy Research 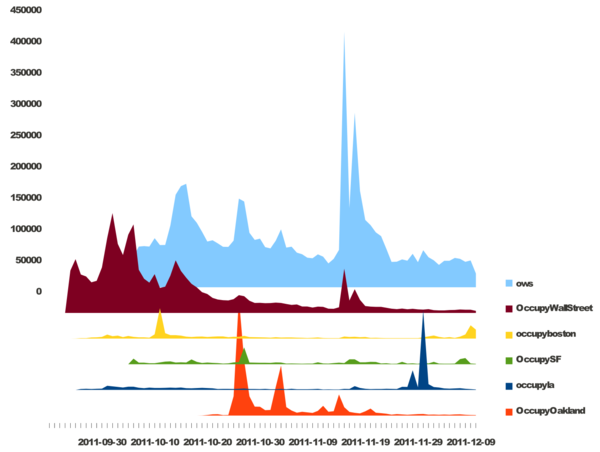 Fig. 9. This project is basically a free/libre open source implementation of trendistic. We started with the following sketch of Tweet volume by city, displayed in parallel. From there, Pablo used inkscape and libreoffice to create the following static mock-up, using the real data from the #OccupyData dataset from r-shief.org. Documentation: Occupy Hashtag Timeline Visualization|Occupy Research 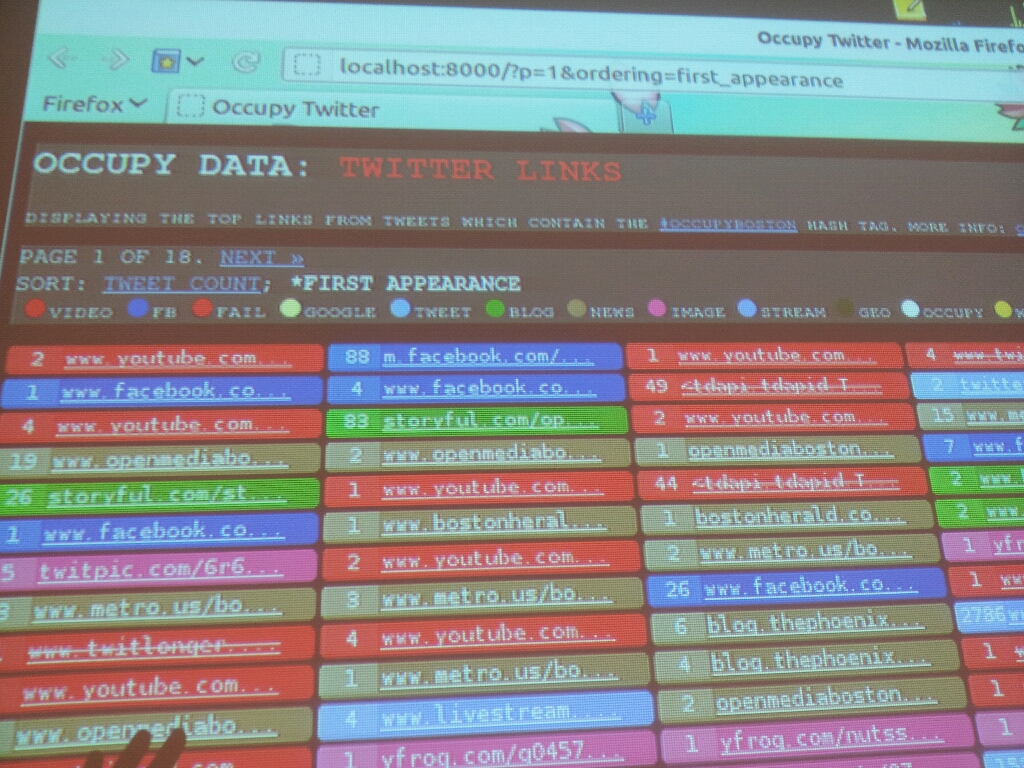 Fig. 10. The process to pull all the hyperlinks from OccupyBoston data was interesting. Here is the live visualization: Occupy Twitter 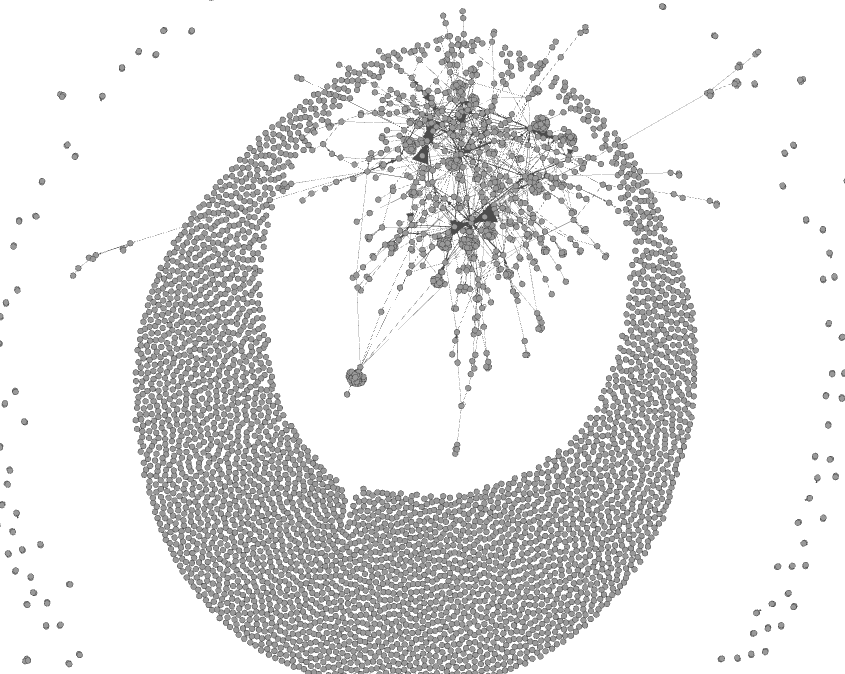 Fig. 11. Here Micha Cárdenas experiments for the first time with Gephi. This is a preliminary Gephi test graph of #OccupyAmsterdam tweets for #OccupyData, screencap while sorting tweets Twitter / micha cárdenas 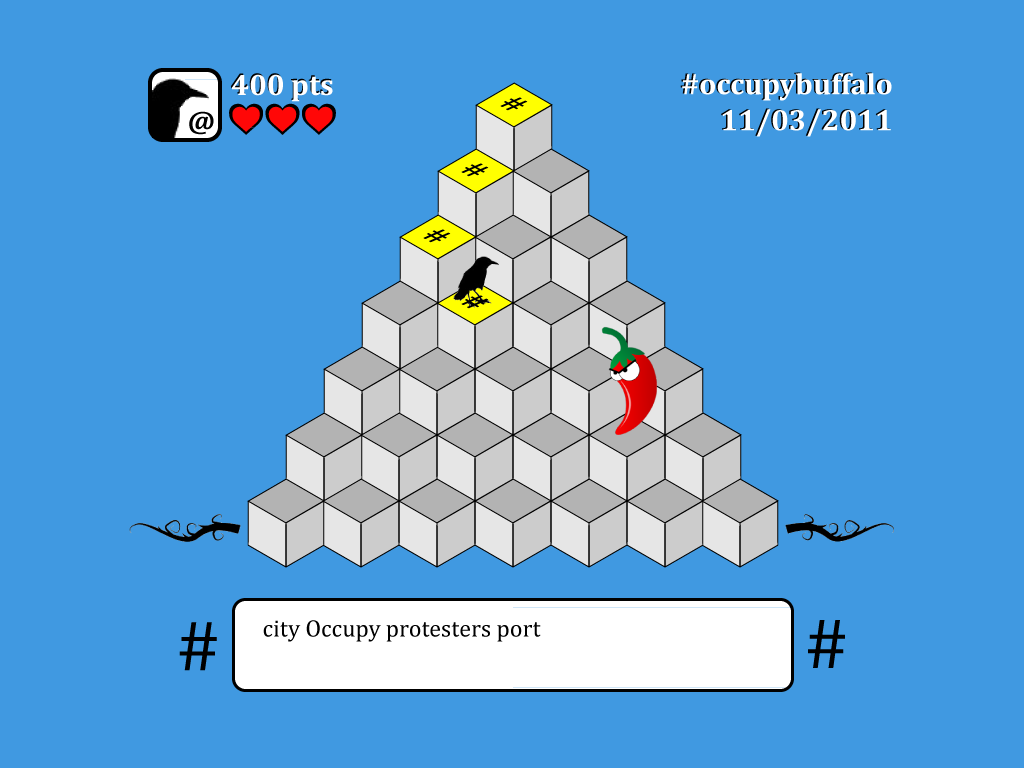 Fig 12. Concept art for #rustltd in-progress #OccupyData Hackathon game -- Twitter / Adam Liszkiewicz  Fig 13. OccupyAmsterdam Gephi by Utrecht team. See their article, "#OccupyData Hackathon. Analysing millions of tweets." BEGINNING DAY 3 I am now on my way to the 3rd and final day of the hackathon. I am looking forward to seeing the final projects and to reading reflections and considerations on how we can do this better next time. This was a first step, a shot in the dark. Post-hackathon production will include a showcase of all the work and a written report of the event. Participants, please send us your submissions by midnight tonight! For questions, contact dan@r-shief.org or reference https://bit.ly/occupyhackathon. Stay tuned for more. In addition to documentation, check out this new exciting survey, which aims to create a better understanding of who engages with the Occupy movement, and how — it includes questions about media, communication, political activities, and more. VJ Um Amel Media Artist and Critic iMAP student at USC |

2117 views
|

|
| Thread Tools | Search this Thread |
| Display Modes | |
|
|


 Linear Mode
